
FIGURE 5.
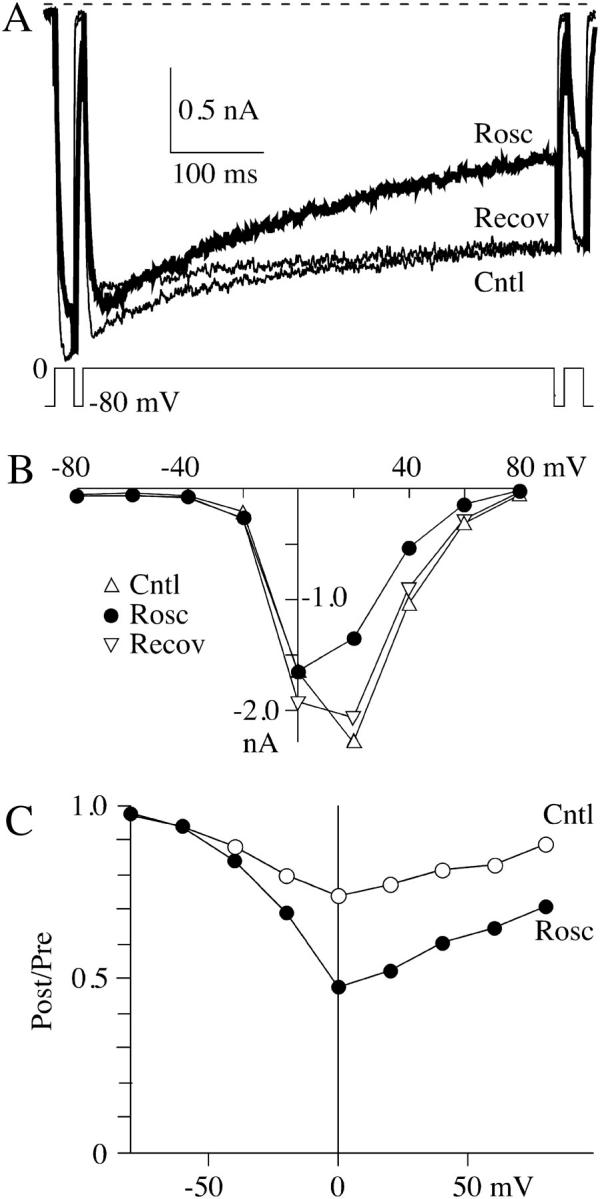
Roscovitine increases N-channel inactivation. (A) A triple pulse protocol was used to examine the effect of roscovitine on inactivation. The prepulse and postpulse were 20-ms steps to 0 mV, whereas the 500-ms inactivation pulse was to voltages ranging from −80 to +80 mV (20-mV increments). The increased inactivation induced by 100 μM roscovitine can be observed during the 500-ms step to 0 mV. The external solution contained 30 mM Ba2+. (B) A plot of peak current measured during the 500-ms step versus the step voltage. The peak current was measured as the average ±2.5 ms around the peak. (C) The ratio of the postpulse current to prepulse current is plotted versus the inactivation step voltage. This relationship in control shows the characteristic U-shaped voltage dependence of N-current inactivation. The addition of 100-μM roscovitine increased inactivation at voltages >−40 mV. The voltage-generating maximal inactivation did not appear to be altered by roscovitine. Control was calculated as the average of the post-/pre- ratio before and upon recovery from roscovitine. The data in all panels are from the same cell.