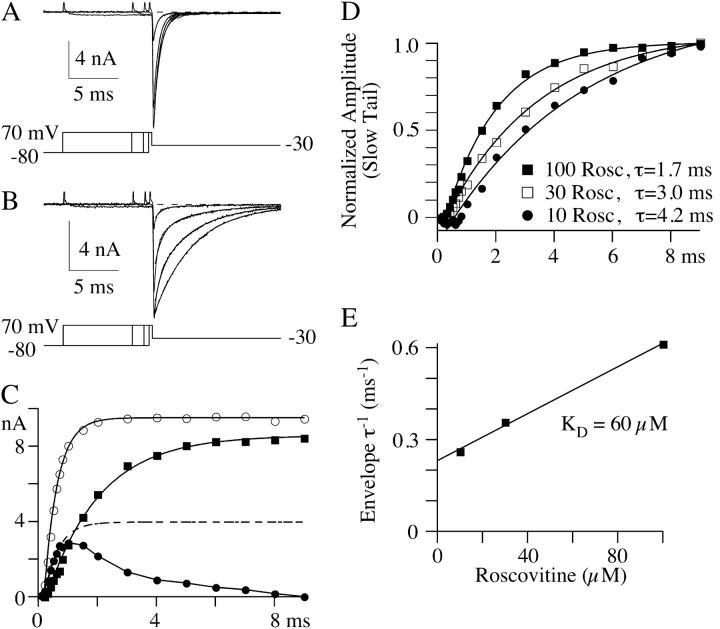
FIGURE 6.
N-channels must open before roscovitine can bind to affect deactivation kinetics. Currents generated during a tail current envelope paradigm are shown from the same cell in both control (A) and 100-μM roscovitine (B). The +70 mV step durations shown are 0.3, 0.8, 2.0, and 9.0 ms for both control and roscovitine. Exponential fits to the tail currents are superimposed on the tail currents. These fits were single-exponential equations for control, whereas double exponentials were used for tail currents in roscovitine. The currents were recorded 30 mM Ba2+. (C) The amplitudes of the exponential fits are plotted versus step duration. These amplitudes were fit to a single exponential (after a 0.3-ms delay) to obtain an estimate of the activation τ for each component. For control (open circles) the activation τ was 0.4 ms. The single-exponential fit to control data was scaled (*0.4, dashed line) to show that the fast deactivation component (control-like τD, solid circles) in roscovitine activated with the same time course as that in control. The amplitude of this component peaked at ∼1 ms and monotonically declined with longer step pulses. The amplitude of the slowly deactivating current in roscovitine (solid squares) increases monotonically with step duration after a brief delay (∼0.3 ms). These data and their single-exponential fit are replotted in D along with data from 10- and 30-μM roscovitine to illustrate the concentration-dependence of activation of the slowly deactivating tails. The time constants for each fit are indicated. (E) A plot of the roscovitine-induced inverse envelope τ versus roscovitine concentration is well fit by a linear regression (see text). The slope of this line is 0.0038 μM−1 ms−1 and the y-intercept is 0.23 ms−1, which yields KD = 60 μM. Data in A–D are from the same cell, and data in E are the average of three cells.

