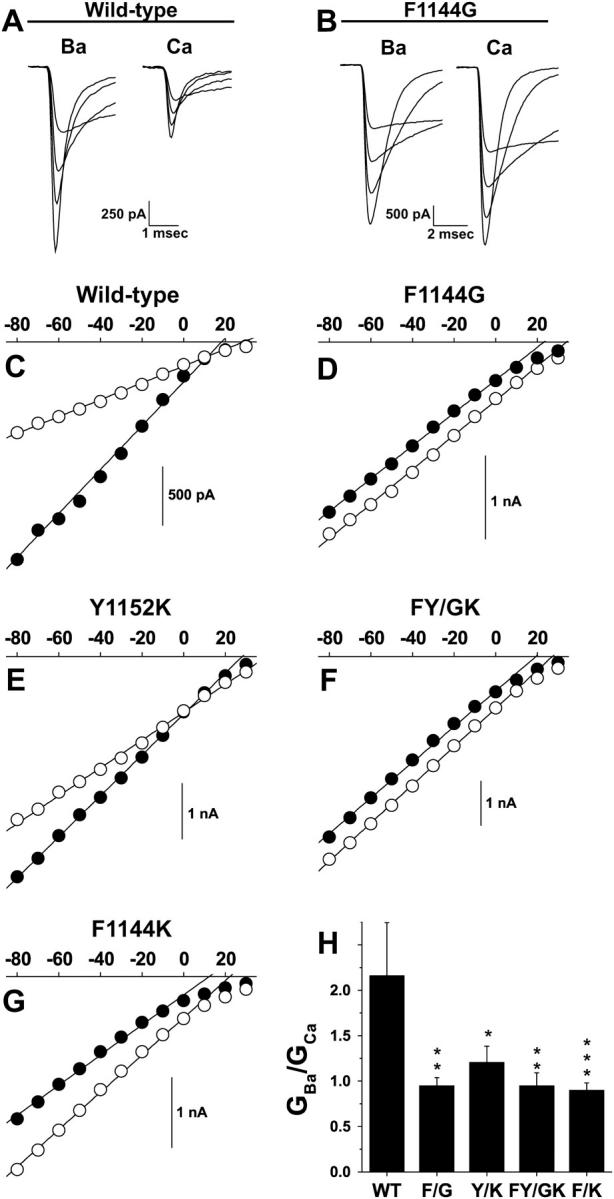
FIGURE 6.

Whole-cell maximal slope conductances for F1144G, Y1152K, FY/GK, and F1144K are reduced. Whole-cell instantaneous I/V relations were generated by depolarizing wild-type and mutant cell membranes to +50 mV for 100 ms and then repolarizing them to test potentials ranging from −80 mV to +30 mV. (A and B) Tail currents evoked from repolarizing steps to −80, −60, −40, and −20 mV were generated in Ba2+ and Ca2+ from the same cell for wild-type (A) and F1144G (B). (C–G) Peak tail current amplitudes were measured in 10 mM Ba2+ (solid symbols) and 10 mM Ca2+ (open symbols) and plotted against the voltage of the repolarizing step. The linear portions of these data were fit using the equation Itail = G × (V – Erev), where Itail is the peak tail current, G is the maximal slope conductance, and Erev is the reversal potential. Reversal potentials extrapolated by linear fits are more negative than their true reversal potentials, because the open channel I–V is nonlinear near the reversal potential for calcium channels. H. GBa is divided by GCa from the same cell to give GBa/GCa. Notice GBa/GCa values exhibit the same trends as IBa(max)/ICa(max) values from Fig. 5: wild-type, 2.16 ± 0.58, n = 7; F1144G, 0.95 ± 0.087, n = 11; Y1152K, 1.21 ± 0.18, n = 8; FY/GK, 0.95 ± 0.14, n = 5; and F1144K, 0.90 ± 0.080, n = 9.
