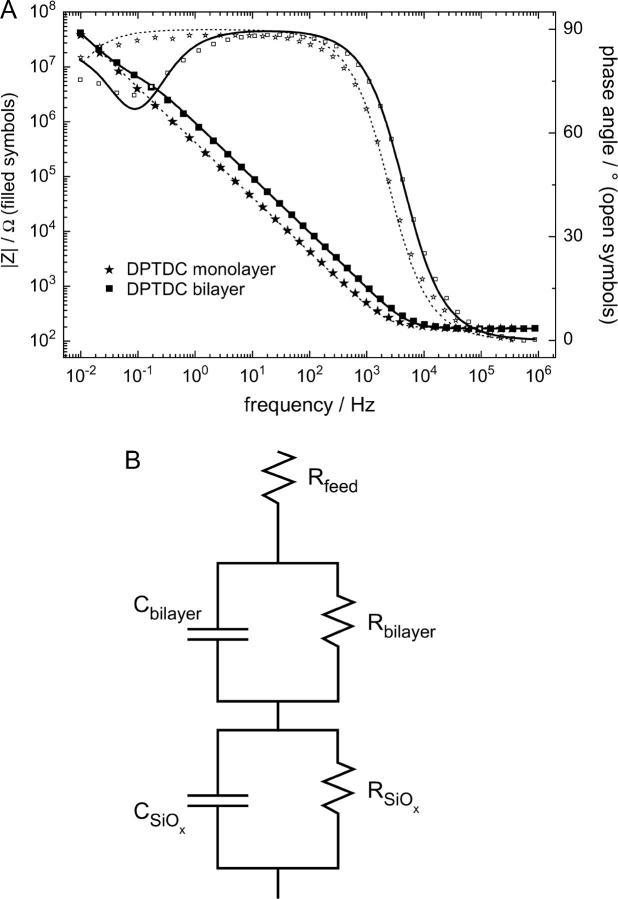
FIGURE 3.
(A) Bode plot of the EIS of a DPTDC monolayer (★) and the same sample after 1 day of vesicle fusion (▪). Lines correspond to a fit using an equivalent circuit of a feed resistance in series with an RC element of the bilayer in series with an RC element of the SiOX layer. (B) The fit to the measurement after vesicle fusion (solid line in A) yields RSiOx = 26.7 MΩ, CSiOx = 1.02 μF, Rbilayer = 1.56 MΩ, Cbilayer = 735 nF. Only one RC element representing the oxide layer with the attached SAM has been used to fit the substrate before vesicle fusion (dotted line in A): R = 88.5 MΩ, C = 987 nF.

