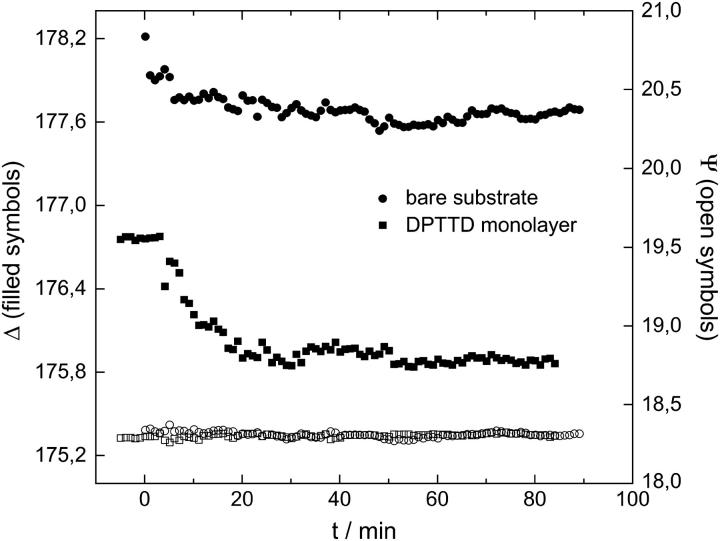
FIGURE 4.
Bilayer growth during vesicle fusion as studied by ellipsometry. Circles represent the formation of a supported bilayer on a bare substrate; squares show the bilayer formation on a substrate with a DPTTC monolayer. For both systems, Δ drops after insertion of the vesicles (0.1 mM DPhyPC 50 nm vesicles, cell filled with MilliQ water) at t = 0 to a constant value after t ∼ 30 min, whereas Ψ remains constant at ∼18.3°.

