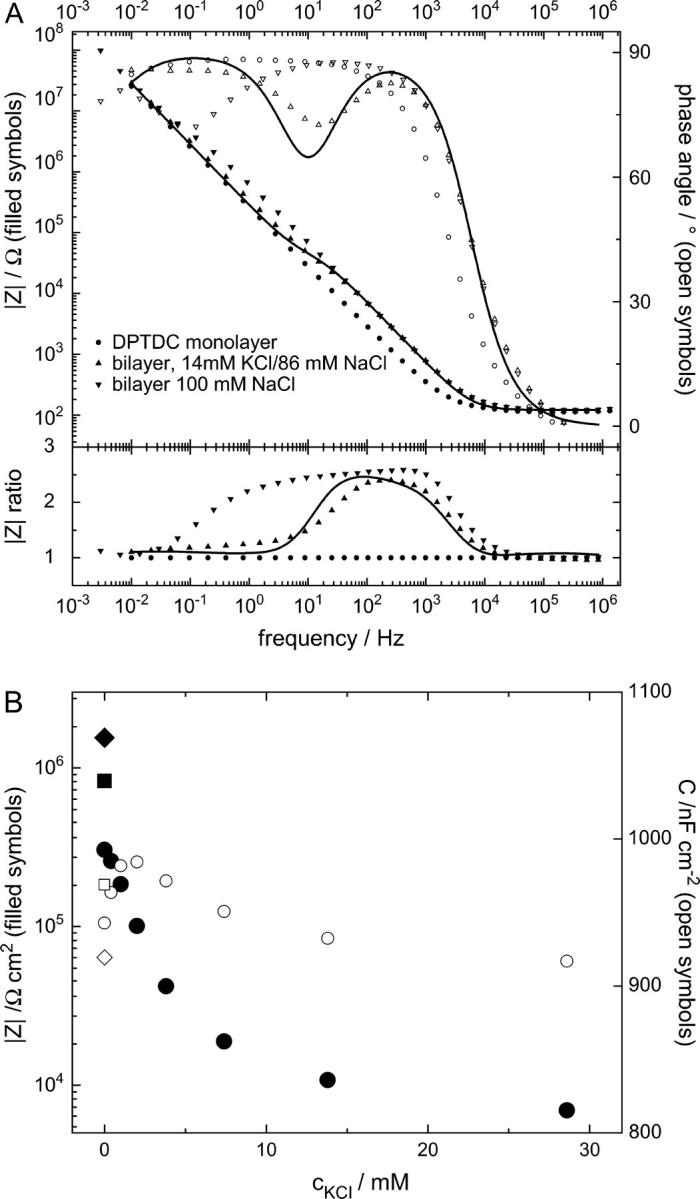
FIGURE 5.

EIS of a bilayer and the effect of incorporated valinomycin at different K+/Na+ concentrations. A shows EIS data in a 100 mM NaCl buffer of a DPTDC covered substrate before vesicle fusion (circles), EIS in a 14 mM KCl/86 mM NaCl buffer after vesicle fusion and addition of 18 μM valinomycin in the cell (upward triangles), and EIS of the same bilayer after thorough rinsing with 100 mM NaCl (downward triangles). The line is a fit of an equivalent circuit (Fig. 3 B). To focus on their differences, the lower part of A displays the same impedance data but normalized to the EIS before vesicle fusion. It can be seen that in the frequency range where the valinomycin acts (below ∼10 Hz, upward triangles) the impedance of the bilayer is strongly reduced, albeit not all the way down to the impedance of the monolayer. In B, circles mark valinomycin incorporated bilayer resistances (•) and capacitance (○) from fits to EIS at different K+/Na+ ratios but constant 100 mM ion strength. After a rapid drop, the bilayer resistance approaches a constant value of ∼7 kΩ cm2 for higher KCl concentrations. The bilayer resistance in 100 mM NaCl before valinomycin incorporation (▪) is lower than after incorporation and rinsing with 100 mM NaCl (♦), which might be due to traces of K+ ions left in the valinomycin. Whereas the resistance varies over two orders of magnitude, the capacitance stays in a narrow range. A pure, protein-free bilayer did not show any or showed very little dependence on the various K+/Na+ ratios.
