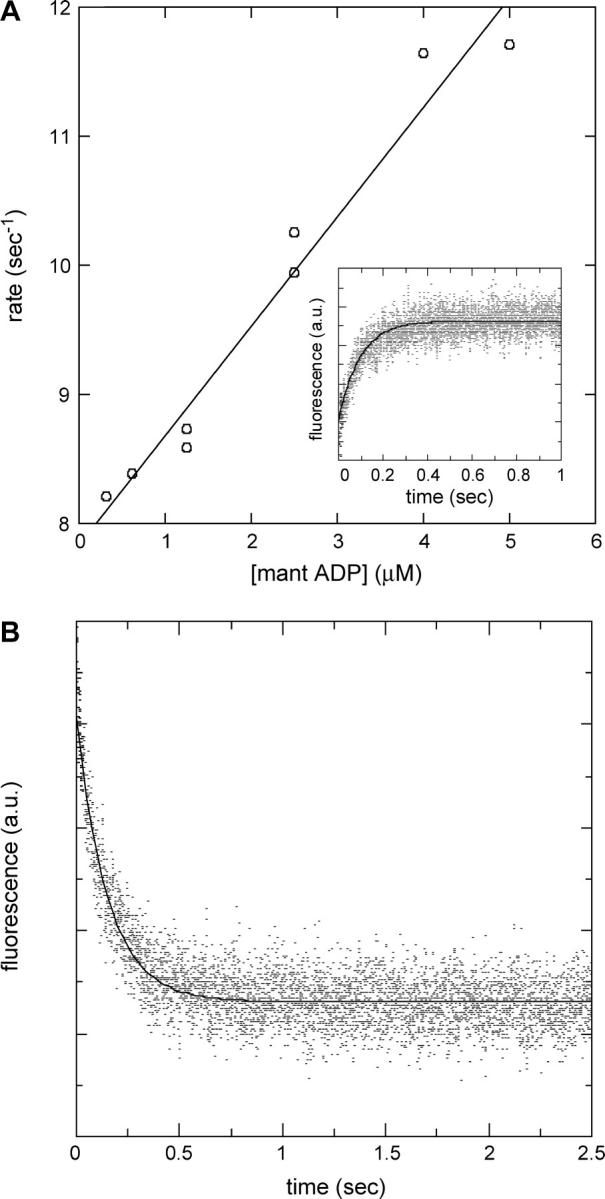
FIGURE 5.

Determination of the F344W-MDE-mant ADP binding and dissociation rates. (A) Linear fit to the plot of the observed rate of binding to F344W-MDE versus mant ADP concentration gives an apparent second-order binding rate constant of 0.79 μM−1 s−1. Attenuation of intrinsic fluorescence from 344W was followed as a function of time as 2 μM F344W-MDE was rapidly mixed with 0.3–5 μM mant ADP. The nonzero y-intercept is equal to the mant ADP release rate and is in good agreement with the value measured experimentally by the chase experiment. The inset shows an averaged trace composed of five stopped-flow records at 2.5 μM mant ADP. (B) Chase experiment to determine the rate of mant ADP release from F344W-MDE. Two micromoles F344W-MDE in the presence of 10 μM mant ADP was rapidly mixed with 500 μM unlabeled ATP, and the resulting attenuation of mant fluorescence was followed as a function of time (averaged data from four traces). A single exponential fit of the data gives an F344W-MDE-mant ADP dissociation rate of 6.47 ± 0.10 s−1. All stopped-flow experiments were performed at 25°C.
