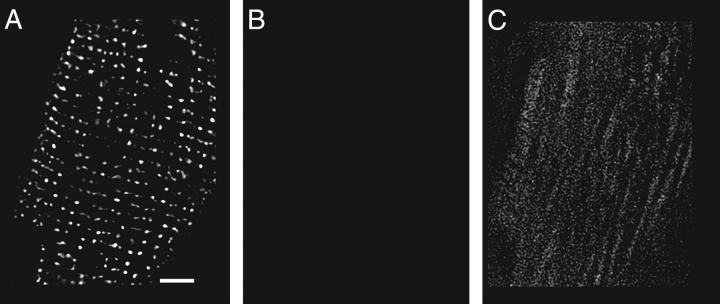
FIGURE 1.
Labeling with two monoclonal antibodies. Each panel is a single image plane showing the distribution of RyR. (A) Distribution detected by a FITC-tagged anti-rabbit IgG antibody, after the monoclonal anti-RyR antibody had been transformed with a mouse anti-rabbit Fab fragment. Scale bar is 5 μm. (B) The same cell labeled with a Texas Red-tagged anti-mouse IgG and displayed identically to A shows nothing. (C) Image B, displayed 10× brighter, shows only nonspecific labeling.

