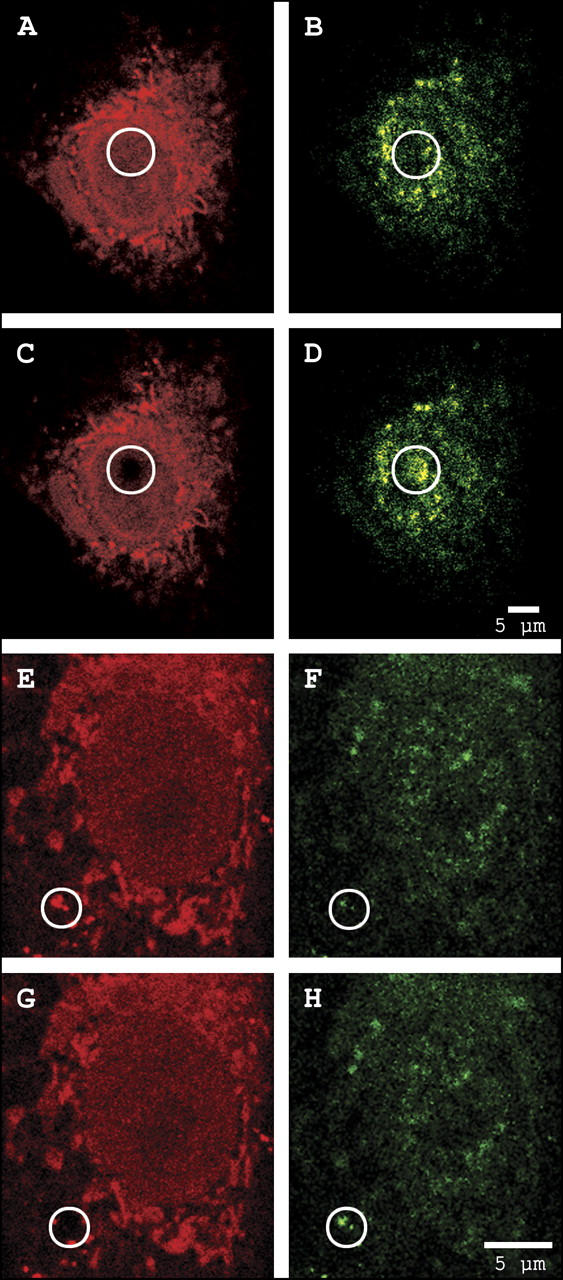
FIGURE 3.

Observation of FRET between exogenous TMR-labeled actin (red) and endogenous FITC-immunolabeled cofilin (green) in the nucleus (A–D) and cytoplasm (E–H). Photodestruction of TMR in the region of interest (circles) results in a corresponding increase in FITC fluorescence intensity. See text for details.
