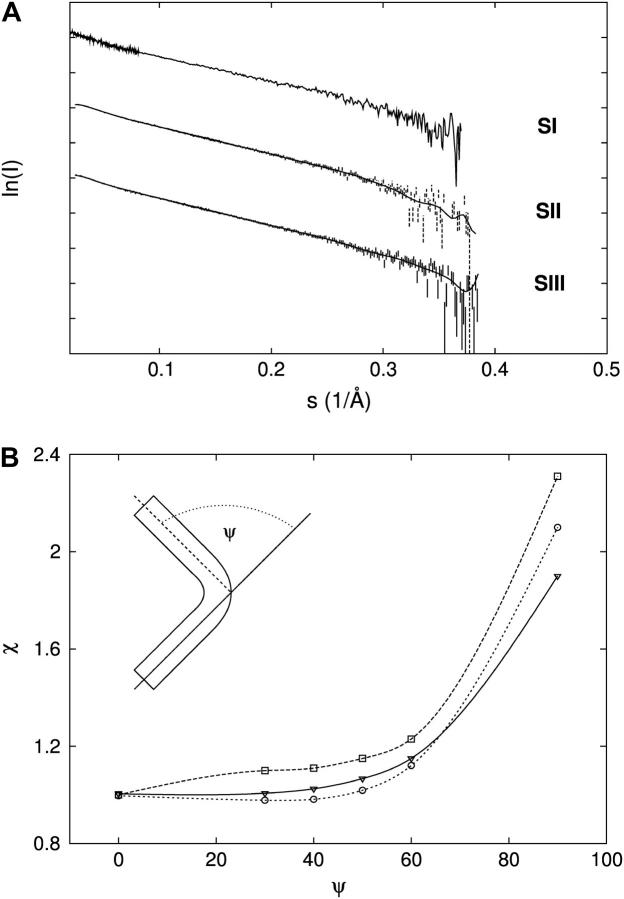
FIGURE 4.
SAXS data for sites I, II, and III. (A) SAXS data for sites I, II, and III (SI, SII, and SIII, respectively). SAXS curves have been shifted on the y axis for clarity. (B) Rigid-body modeling results shown as a plot of the χ of the fit of each DNA structural model (DNAψ, see Materials and Methods) as a function of the kink angle ψ when fitted to the experimental datasets from sites I (down triangles), II (open squares), and III (open circles).

