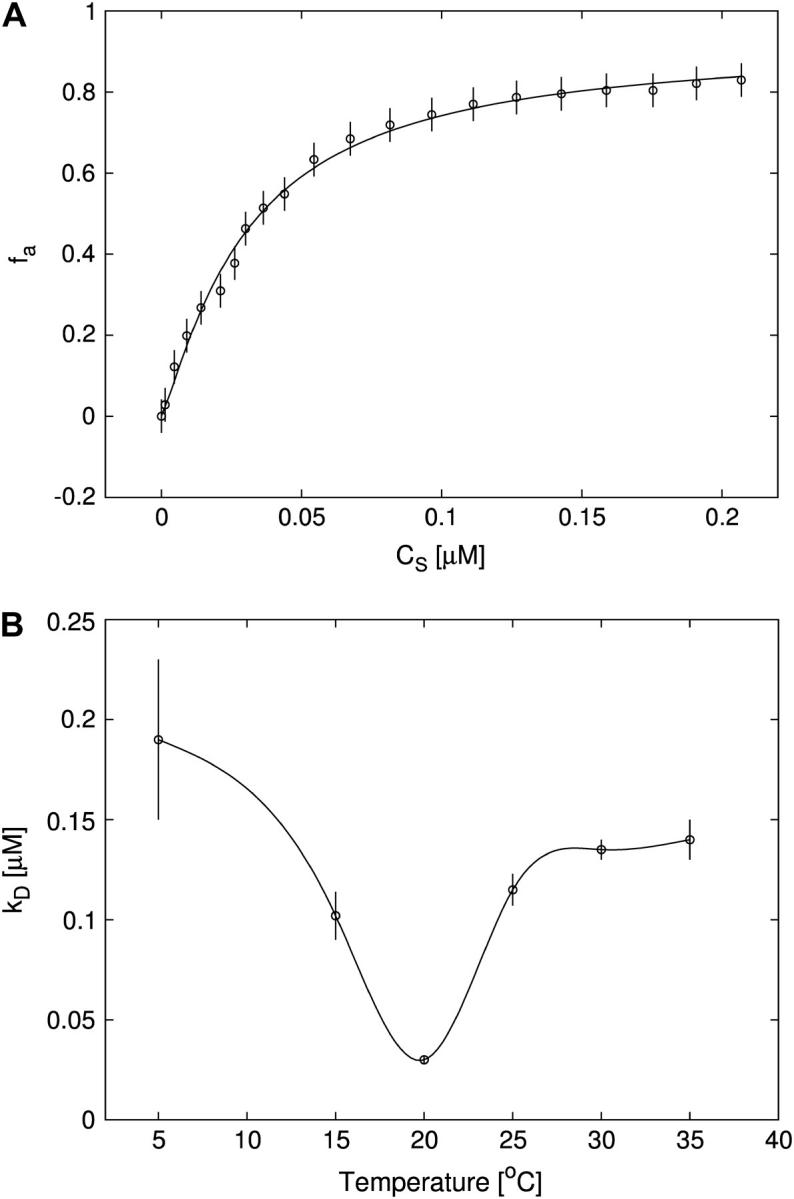
FIGURE 6.

(A) Titration of FI (≈30 nM) with Tn3R at 20°C (open circles) and Hill model best fit (solid curve), with  and n = 1.2. The value fa represents the binding function and CS the free Tn3R concentration (see Materials and Methods). (B) Temperature dependence of the dissociation binding constant
  for the binding of Tn3R to FI in solution, as observed with FA measurements.
  and n were calculated by fitting a Hill model to the binding curves produced at different temperatures (data not shown). Solid lines represent spline approximations, and serve as a guide to the eye.
