
FIGURE 7.
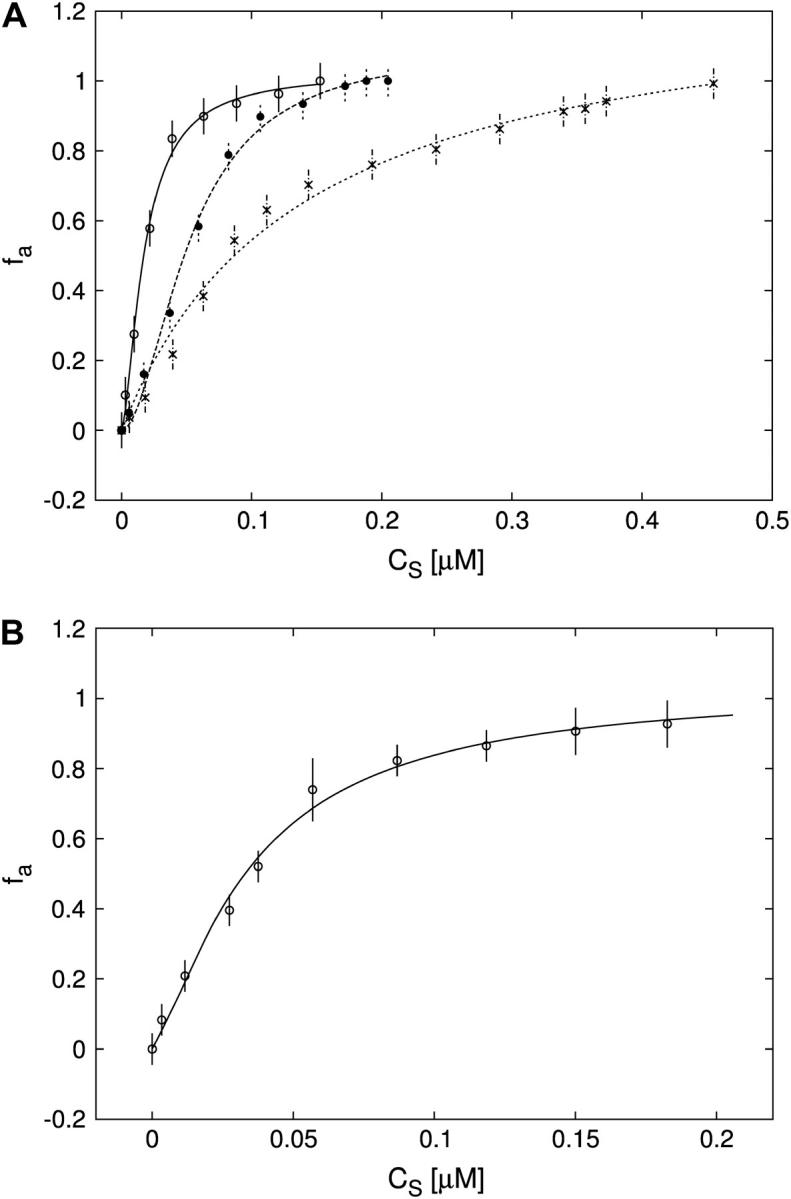
(A) Titration of FII (open circles), FIIL (solid circles), and FIIR (crosses) with Tn3R at 20°C. Binding data were fitted with a Hill model (FII and FIIL) or a one-species model (FIIR), resulting in  n = 1.5 (solid line),
  n = 1.7 (dashed line), and
  (dotted line). (B) Titration of FIII (open circles) with Tn3R at 20°C. Binding data were fitted with a Hill model, resulting in
  with n = 1.4 (solid line).