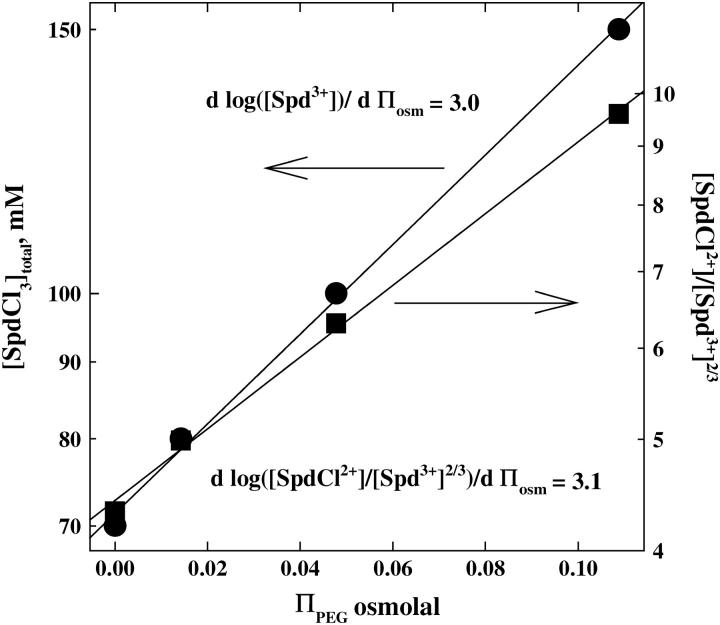
FIGURE 6.
The interdependence of SpdCl3 concentration and PEG osmotic pressure is shown for the hexagonal-to-cholesteric phase transition. The osmotic pressure of excluded PEG acts to oppose the increase in spacing that accompanies the transition. On the left-hand axis the variation of the total SpdCl3 concentration (•) with osmotic pressure is shown. On the right-hand axis, the ratio [SpdCl2+]/[Spd3+]2/3 (▪) calculated using Kd = 150 mM is shown as dependent on PEG osmotic pressure. All samples also contain 10 mM TrisCl (pH 7.5) and were equilibrated at 20°C.

