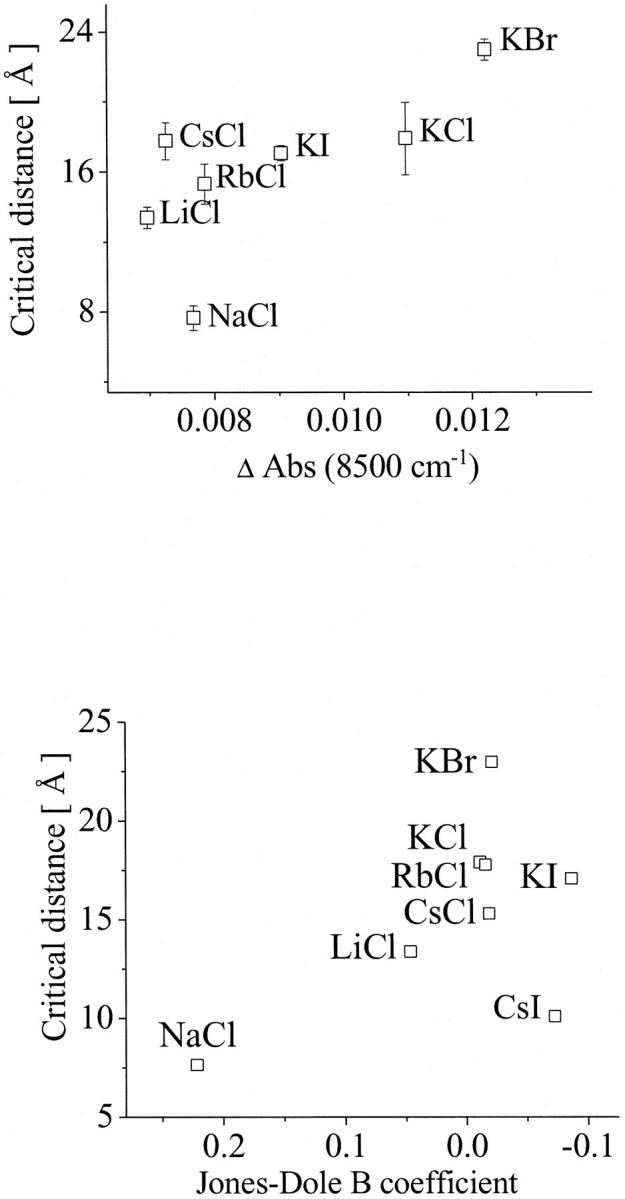
FIGURE 8.

Dependence of the critical distances on the population of weakly H-bonded OH-groups represented by the difference of the absorption intensity at 8500 cm−1 (top) and on the water structure represented by the Jones-Dole B coefficient (bottom). For statistical analysis, see Discussion.
