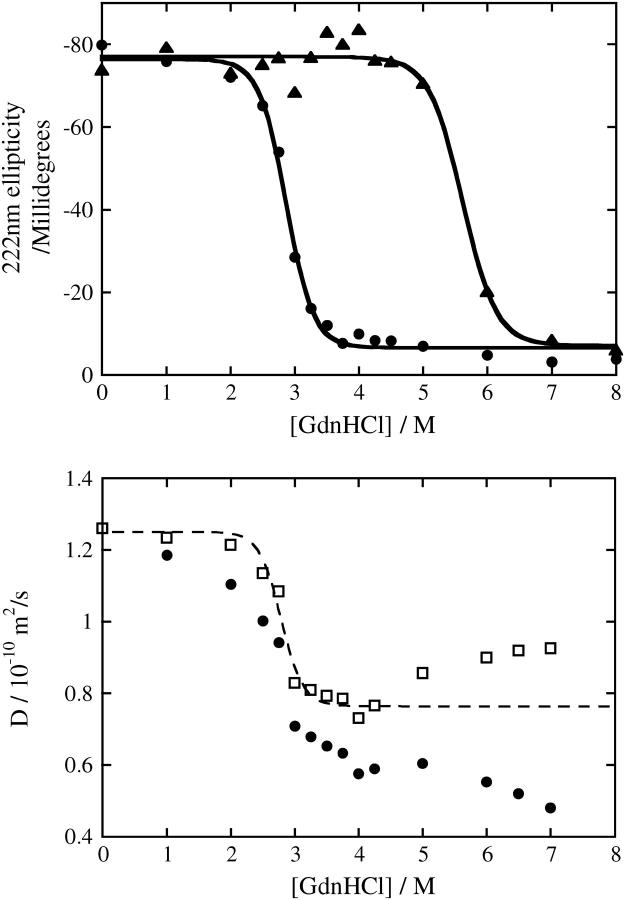
FIGURE 2.
(Top) Denaturation curves of Fe(III) cyt c (•) and Fe(II) cyt c (▴) against GdnHCl concentration in phosphate buffer solution monitored by CD at 222 nm and the best-fitted lines by the two-state model. (Bottom) Denaturation curve of Fe(III) cyt c monitored by the diffusion coefficient (D) and the best-fitted lines by the two-state model (dotted line). Circles and squares represent D of Fe(III) cyt c in the solution and that corrected by the viscosity increase due to the addition of GdnHCl.

