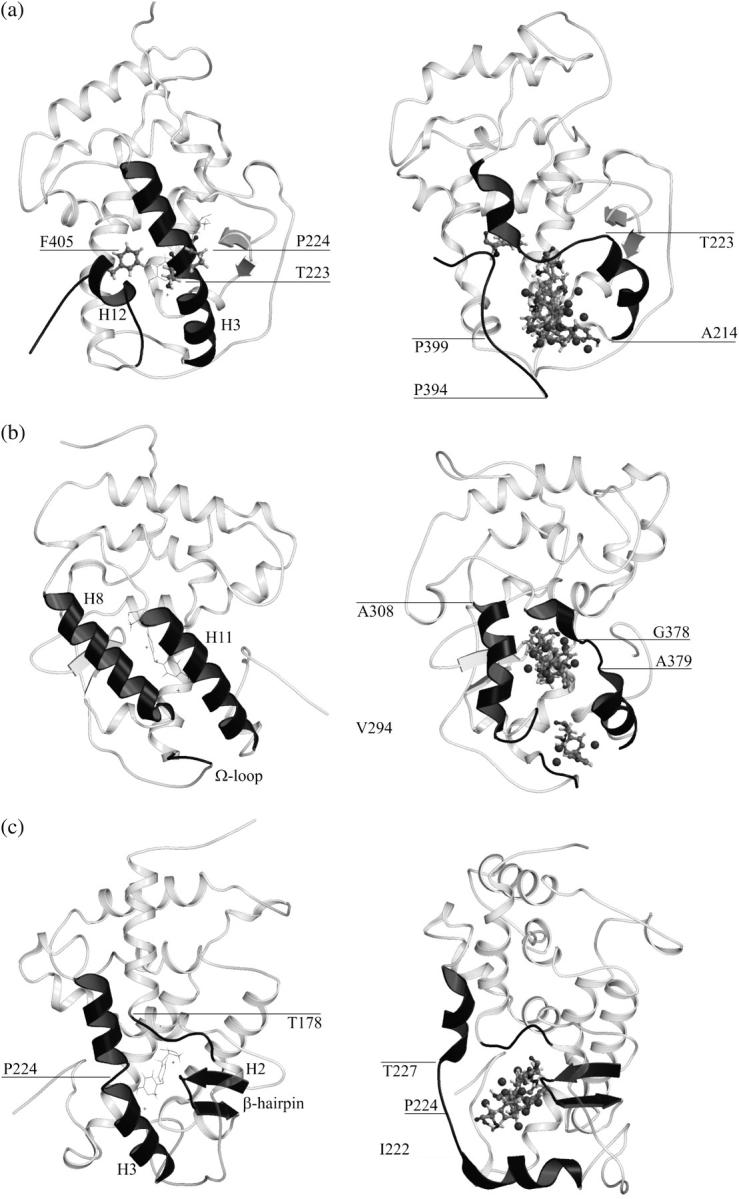
FIGURE 4.

Three ligand escape paths. Snapshots of the simulations showing global views of the paths found for T3 escape from TRα1 are on the right. Corresponding views of the crystallographic structure are on the left. (a) Path I, (b) Path II, and (c) Path III. T3 molecules are shown as lines on the left and as ball and sticks on the right. Some T3 replicas were omitted for clarity.
