
FIGURE 3.
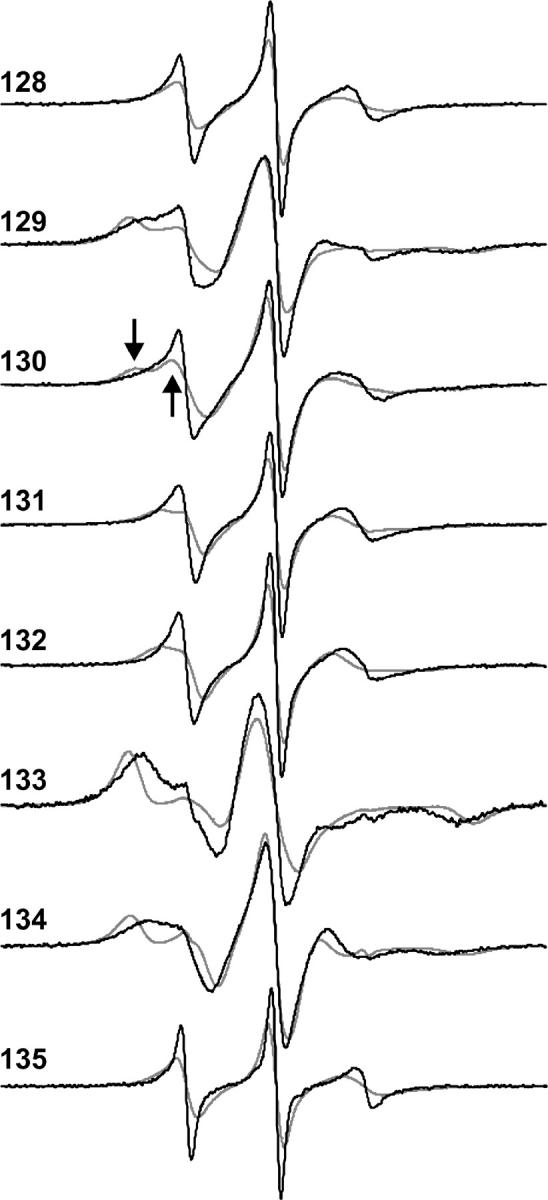
CW-EPR spectra for R1 at the investigated sites in T4 lysozyme. The solid traces are the spectra recorded in buffer at ambient temperature, and the dashed traces are the spectra recorded in 30% sucrose in the same buffer and temperature. The sucrose decreases the rotational diffusion rate by about a factor of three. The arrows on the dotted traces of 130 identify the position of spectral components corresponding to different dynamic modes.