
FIGURE 4.
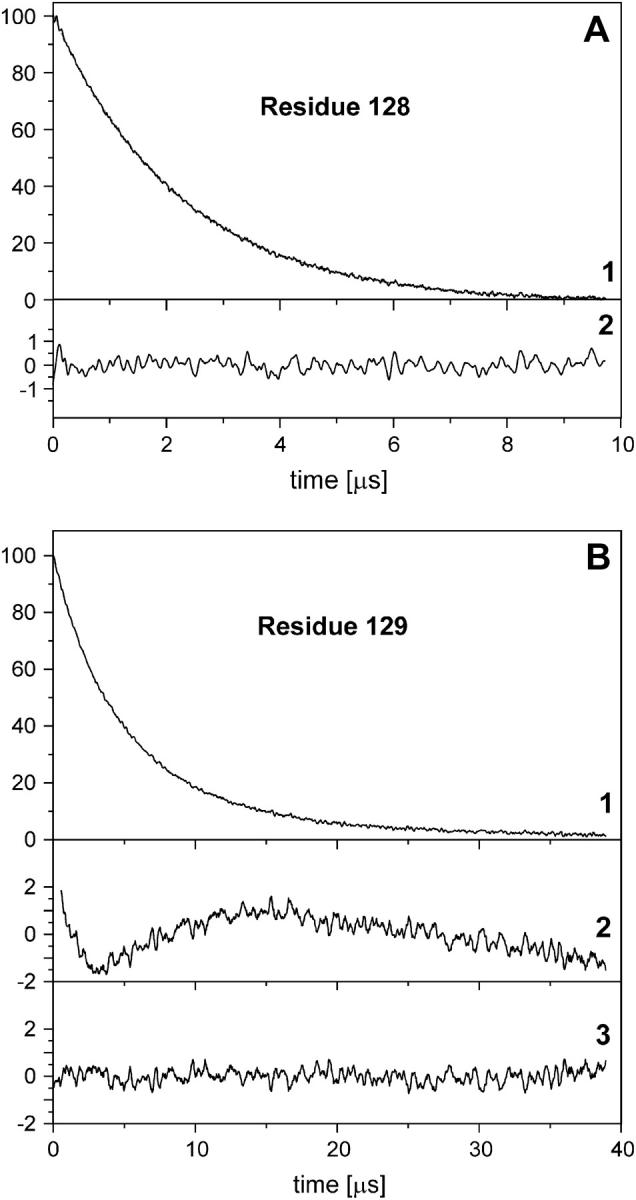
Saturation recovery for R1 at residues 128 (A) and 129 (B) under an argon atmosphere. In each case, trace 1 is the experimental recovery curve and trace 2 is the difference between the experimental curve and a single exponential fit (×5). In panel B, trace 3 is the difference between the experimental curve and a double exponential fit (×5).