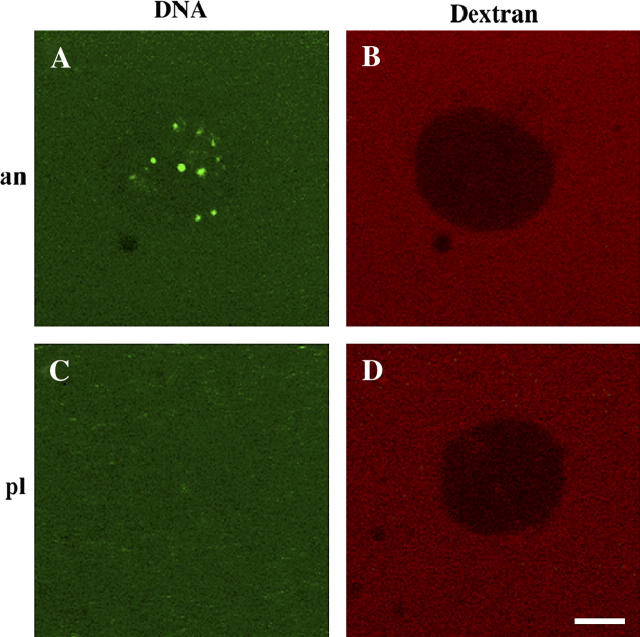
FIGURE 2.
Nuclear import of ssDNA-anVirE2 complex, imaged by scanning fluorescence confocal microscopy, with fluorescent molecules as marked: VirE2 with fluorescein-labeled ssDNA and 167 kDa TRITC-dextran in the left and right columns, respectively. Each row shows the same nucleus in two color channels. Panel A shows that complexes formed with the “animalized” mutant anVirE2 are imported to the nucleus, whereas panel C shows that those formed with the wild-type plVirE2 protein are not. Panels B and D demonstrate integrity of the nuclear envelope for the same two nuclei in panels A and C, by exclusion of large fluorescent dextrans. Scale bar = 5 μm.

