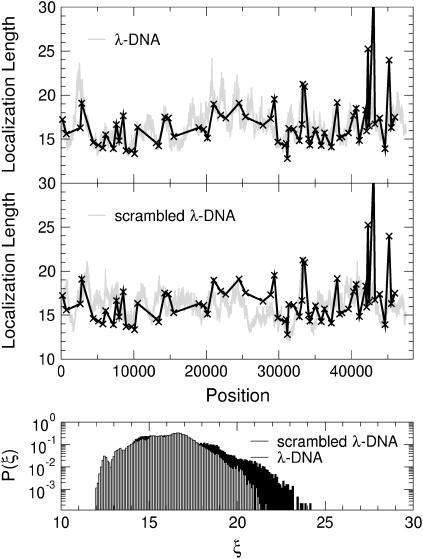
FIGURE 16.
(Top) Variation of the localization lengths for a sliding window of length K = 1000 at E = 3 as in Fig. 15. (Middle) Same as in the top panel but with randomly scrambled λ-DNA. (Bottom) Normalized distribution functions P(ξ) for the localization lengths ξ of λ- (solid) and scrambled-λ-DNA (shaded).

