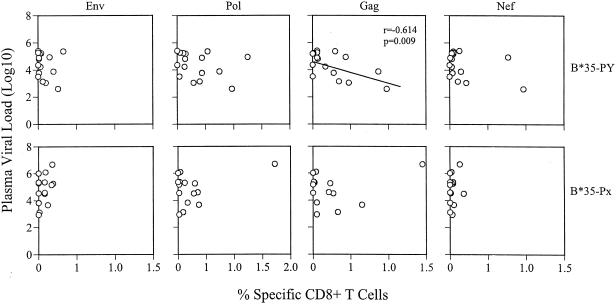
FIG. 4.
Association between viral loads and HIV-1-specific CTL numbers at the time of blood draw. Plots on the upper row are correlations between viremia (log10) levels and Env, Pol, Gag, and Nef specific CTL numbers in the B*35-PY group of patients; those on the lower row are the same correlations for the B*35-Px group of patients. Each open circle represents one patient. There is a significant inverse correlation between Gag-specific CTL and viral load in the B*35-PY group (r = −0.614; P = 0.009).

