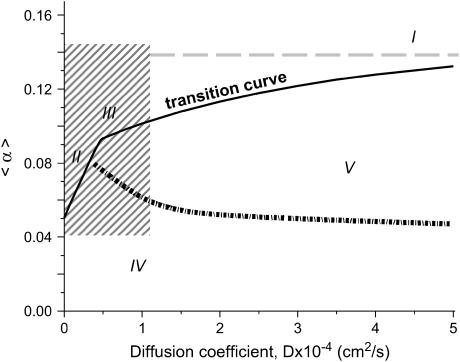
FIGURE 7.
The parameter space diagram with automaticity and cell coupling as coordinates. Automaticity is represented by the coefficient α, which is proportional to the degree of IK1 inhibition (see Construction of the Parameter Space Diagram). The y axis shows mean value 〈α〉 of stochastically distributed α(i,j). The x axis corresponds to the cell-to-cell coupling and is expressed as diffusion coefficient D. Area of the parameter space above the transition curve (solid black curve) corresponds to conditions when the cell network exhibits spontaneous oscillatory activity. Specifically, when D > 10−3 cm2/s (region I), a synchronous beating activity that encompasses the entire network is observed. When D decreases, individual ectopic sources (region II) and ectopic waves with numerous wavebreaks (region III) are observed. Area of the parameter space beneath the transition curve corresponds to conditions when the cell network does not exhibit spontaneous activity. It is divided into two regions. Region IV corresponds to the conditions at which an externally elicited wavefront fails to propagate. When the network is found under Region V it is quiescent on its own, but will propagate an externally initiated wave. The area of the parameter space shown by a shaded rectangle is the main focus of our study and is considered in more details throughout the rest of the figures (Figs. 8–15).

