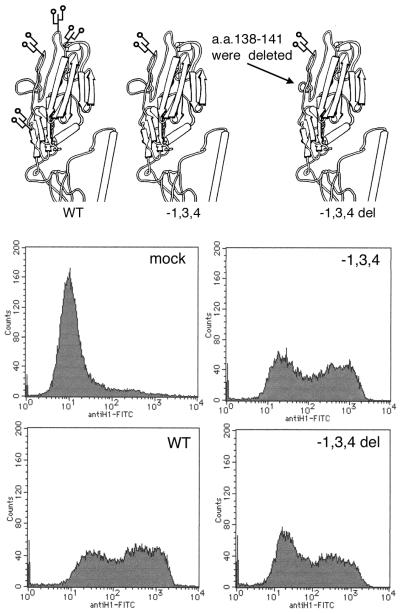
FIG. 6.
Deletion of four amino acids adjacent to the receptor binding site and FACS analysis for the levels of cell surface expression of the mutant and WT HAs. A part of the three-dimensional model of the H3 HA monomer of Wilson et al. (26) was used to illustrate H1 WT and mutant HAs. An uninfected CV-1 cell culture was used for mock infection. FITC, fluorescein isothiocyanate.

