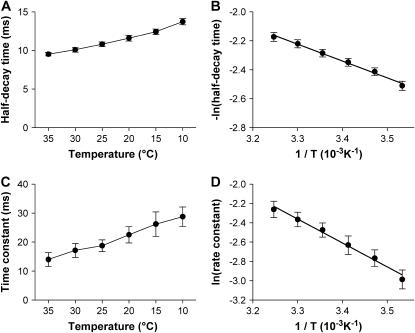
FIGURE 7.
Thermodynamic analysis of recovery kinetics of Ca2+ sparks. (A and C). Temperature dependence of half-decay time (A) and late time constant (C) of Ca2+ sparks (p < 0.01). (B and D). Arrhenius plot of the reciprocal of half-decay time (B) and late time constant (D). The solid lines represent linear fitting with Eq. 3.

