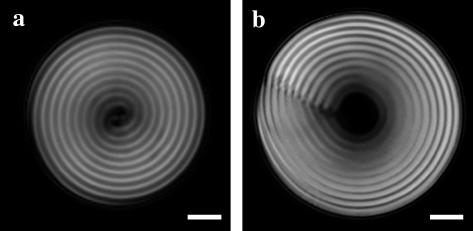
FIGURE 2.
DNA cholesteric spherulites bathed in (a) 11 and (b) 17 wt % PEG 35,000 solutions (10:1 TE at pH 7.8, 0.5 M NaCl; scale bar = 5 μm). The distance between two striations represents the cholesteric pitch, which is ∼2.7 μm for each of the spherulites shown. Both diametrical (a) and radial χ disclination (b) lines are observed in the spherulites.

