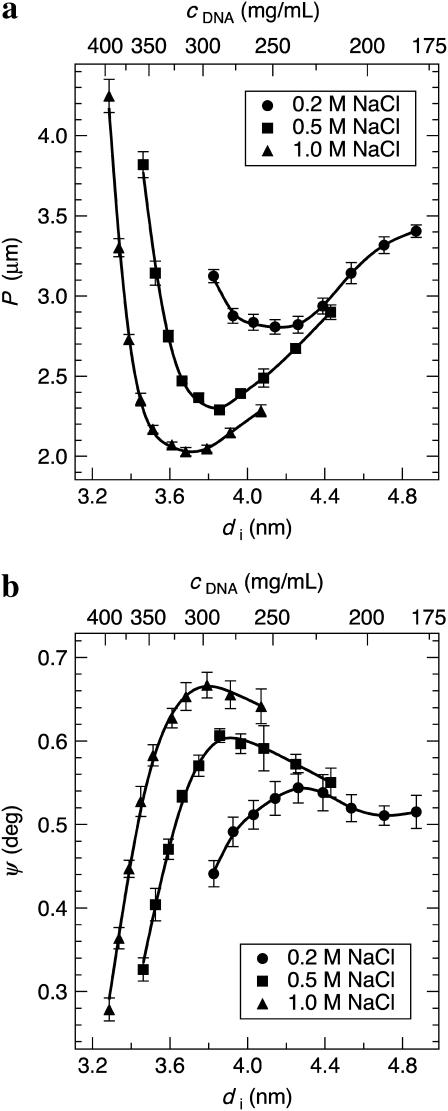
FIGURE 5.
(a) The DNA cholesteric pitch as a function of interaxial spacing for 0.2, 0.5, and 1.0 M NaCl. The top axis gives the DNA concentration calculated from the interaxial spacing. The pitch unwinds at low and high DNA densities, where the cholesteric to isotropic and cholesteric to hexagonal phase transitions are approached, respectively. The pitch minimum, occurring between di = 3.6 and 4.2 nm, is found to shift toward smaller interaxial spacings with increasing ionic strength. (b) The calculated twist-angle shows similar trends to the cholesteric pitch.

