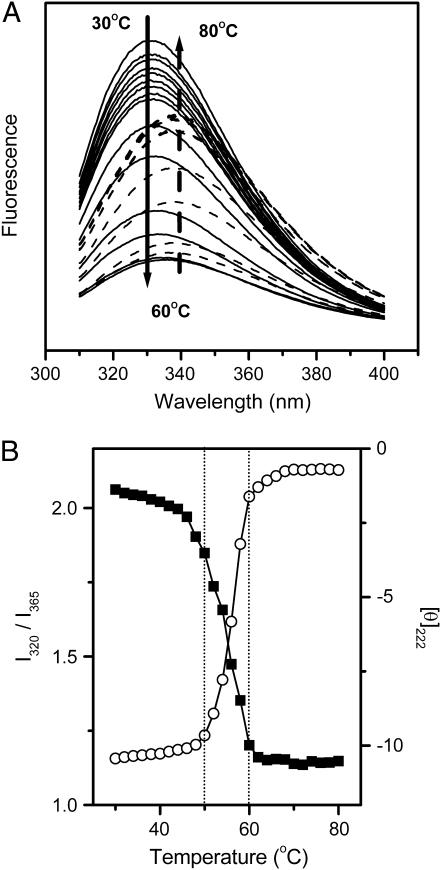
FIGURE 2.
Thermal dependence of the intrinsic fluorescence spectra (A) and thermal melting curves (B) of RMCK. In A, the spectra recorded at temperatures between 30 and 60°C are represented by solid lines, whereas those recorded at temperatures between 60 and 80°C are represented by dashed lines. The arrows show the direction of the intensity change with increasing temperature. In B, thermal melting curves were obtained by monitoring the ratio of the intensity of the intrinsic fluorescence at 320 nm to that at 365 nm (I320/I365, ▪) and the mean residue ellipticity at 222 nm ([θ]222, ○). [θ]222 was expressed in [103 × deg × cm2 × dmol−1].

