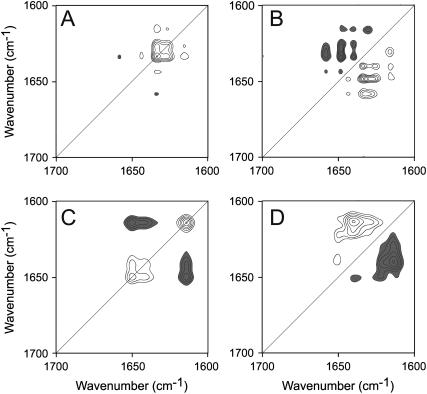
FIGURE 5.
2D correlation analysis of the IR spectra of RMCK thermal denaturation. The synchronous (A and C) and asynchronous (B and D) plots were constructed from the Fourier self-deconvolution spectra in Fig. 4 B in the range of 30–48°C (A and B) and 50–70°C (C and D). The plots are presented as contour maps, constructed by drawing the contour lines every 10% off from the maximum intensity of the corresponding map. Clear peaks are positive and dark peaks are negative.

