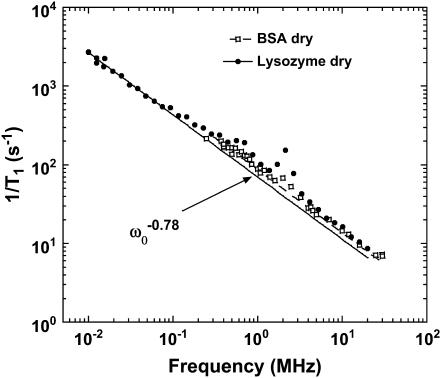
FIGURE 1.
The proton spin-lattice relaxation rate recorded as a function of the magnetic field strength plotted as the proton Larmor frequency for samples of dry lysozyme and BSA at room temperature. The solid line presents the best fit of the data with Eqs. 3a and 3b and b = 0.78. This value of b leads to a value df = 3 from Eq. 3b, which indicates a uniform distribution of protons. The peaks at 2.8, 2.4, and 0.8 MHz in the relaxation rate profile are caused by proton relaxation coupling to the amide nitrogen when the 14N energies match the proton Zeeman levels.

