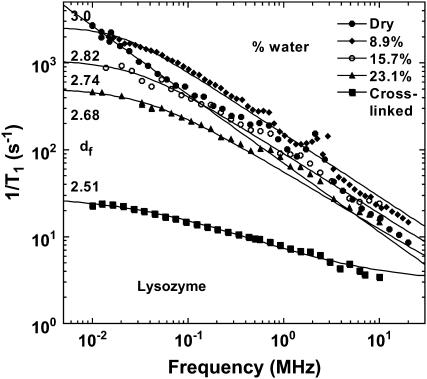
FIGURE 2.
The proton spin-lattice relaxation rate recorded as a function of the magnetic field-strength plotted as the proton Larmor frequency for lysozyme samples hydrated to various degrees (weight %) at room temperature. The solid lines are the best fits to the data using Eqs. 3a and 3b. The two parameters adjusted are b and the exchange rate constant between the protein protons and the water proton populations. The value df is obtained from b according to Eq. 3b.

