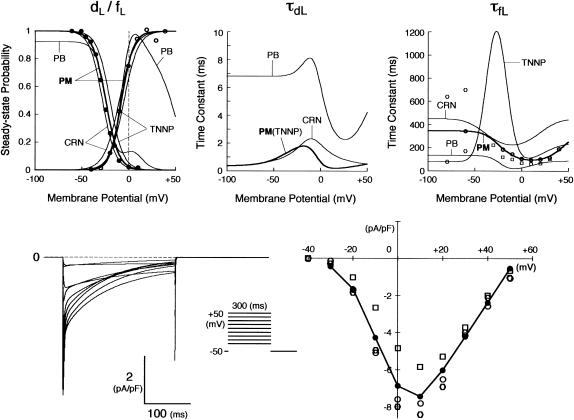
FIGURE 1.
Kinetics of ICa,L. (Top) Voltage dependence of steady-state probabilities (dL∞, fL∞) and time constants for ICa,L activation (τdL) and inactivation (τfL). Equations used for the current (modified) model are shown with the thick lines (labeled “PM”). For comparison, those for existing (original) models are also shown with the thin lines: PB, Priebe and Beuckelmann (15); TNNP, ten Tusscher et al. (16); CRN, Courtemanche et al. (19). The experimental data for dL∞, fL∞, and τfL are from Bénitah et al. (21) (circles), Pelzmann et al. (22) (squares), and Li et al. (23) (hexagons). (Bottom) Computed voltage-clamp records for ICa,L (left) and peak ICa,L-V relationship (right). Currents were evoked by 300-ms step pulses from a holding potential of −50 mV to test potentials ranging from −30 to +50 mV in 10 mV increments. Simulating the whole-cell perforated-patch recording, [Ca2+]i was not clamped, whereas [Na+]i and [K+]i were fixed at 5 and 140 mM, respectively. The experimental data for the peak ICa,L-V relation are from Bénitah et al. (21) (open circles), Pelzmann et al. (22) (squares), and Li et al. (23) (hexagons).

