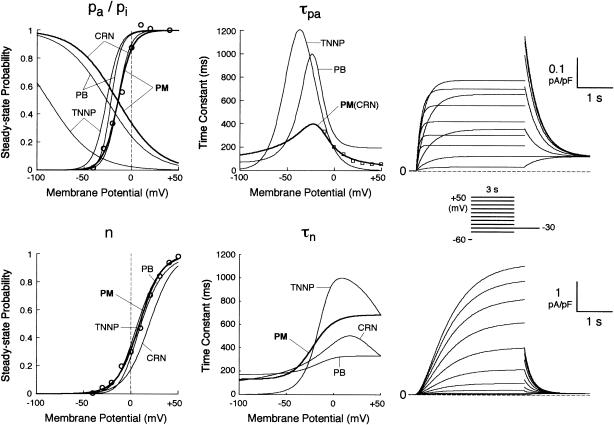
FIGURE 2.
Kinetics of IKr (top) and IKs (bottom). (Left, middle) Voltage dependence of steady-state probabilities and time constants of IKr activation (pa,∞, τpa) and inactivation (pi,∞) as well as IKs activation (n∞, τn). The thick lines are for this study (PM); the thin lines are from the existing models (PB, TNNP, CRN). The experimental data for pa,∞, τpa, and n∞ are from Li et al. (24) (circles) and Wang et al. (25) (squares). (Right) Computed voltage-clamp records for IKr and IKs. Currents were elicited by 3-s step pulses from a holding potential of −60 mV to test potentials ranging from −50 to +50 mV in 10 mV increments.

