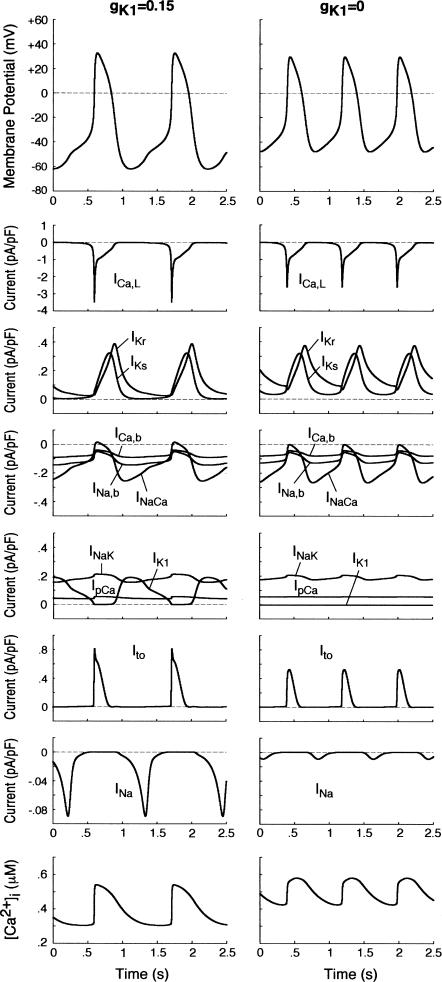
FIGURE 4.
Simulated steady-state BP activities (spontaneous APs, ionic currents, and [Ca2+]i dynamics) in the model HVM at gK1 = 0.15 (left) and 0 (right). Differential equations (Eqs. 55–63) were numerically solved for 20 min at each gK1 with initial conditions appropriate to an EP and a 1-ms stimulus of 1 pA/pF for triggering an AP; model cell behaviors during the last 2.5 s starting from MDP are depicted. Note the differences in the ordinate scales for individual currents.

