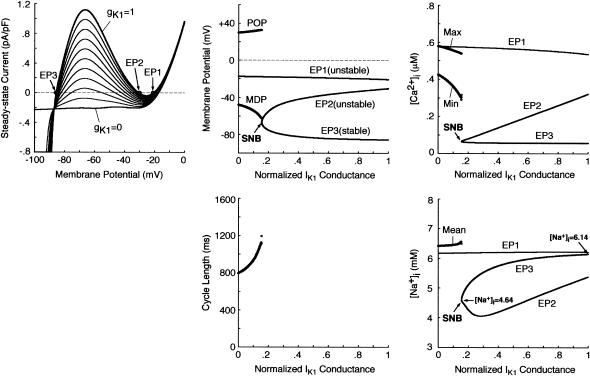
FIGURE 5.
Bifurcation structure of the model HVM during gK1 decreases. (Left) Steady-state I/V relations for gK1 = 0 − 1, depicted at an interval of 0.1 with [K+]i fixed at 140 mM. The zero-current crossings, corresponding to EPs, are designated by EP1, EP2, and EP3. (Middle) A bifurcation diagram for gK1 with the steady-state (EP1–3) and stable periodic (MDP, POP) branches (top), and CL plotted as a function of gK1 (bottom). EPs were determined by the algebraic equations (Eqs. 65–69). The model cell dynamics were computed by numerically solving the differential equations (Eqs. 55–63) for 10 min at each gK1, which was reduced at an interval of 0.001, with the initial [Na+]i at gK1 = 1 set equal to 6.14 mM. The saddle-node bifurcation point at which EP2 and EP3 merge together and disappear is located (labeled SNB at gK1 = 0.154). (Right) Steady-state [Ca2+]i (top) and [Na+]i (bottom) at EPs as functions of gK1. The minimum (Min) and maximum (Max) of [Ca2+]i, as well as average [Na+]i, during the BP oscillations are also plotted. Note that the steady-state [Na+]i at EP3 reduces with decreasing gK1.

