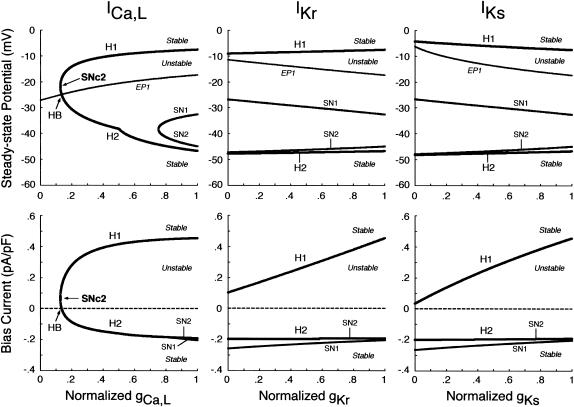
FIGURE 7.
Changes in the unstable regions of the Ibias-V0 curve during inhibition of ICa,L, IKr, or IKs. Displacements of Hopf (H1, H2) and saddle-node (SN1, SN2) bifurcation points in the Ibias-V0 curve with decreasing gCa,L, gKr, or gKs at an interval of 0.001 are shown for the IK1-removed BP system. Values of V0 and Ibias at the bifurcation points were plotted on the potential (top) and current (bottom) coordinates, respectively, as functions of the conductance. The path of the control V0 at Ibias = 0 (i.e., EP1 in Fig. 6) is also shown on the potential coordinates, intersecting the locus of H2 at gCa,L = 0.134 (labeled HB). Note that the unstable region exists between H1 and H2 (or H1 and SN2), where spontaneous oscillations occur. A codimension two saddle-node bifurcation at which the loci of H1 and H2 merge together, i.e., the unstable region disappears occurred at gCa,L = 0.126 (labeled SNc2).

