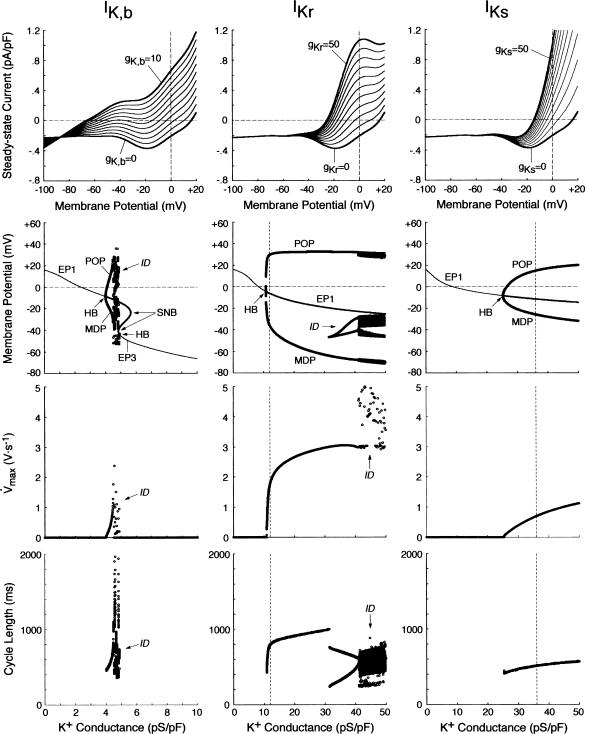
FIGURE 8.
Effects of incorporating various K+ currents with different kinetics (IK,b, IKr, or IKs) on EP stability and dynamics of the IK-removed model cell (gK1 = 0). (Top) Steady-state I/V relations for gK,b = 0–10 pS/pF (left), gKr = 0–50 pS/pF (middle), and gKs = 0–50 pS/pF (right), depicted at an interval of 1 or 5 pS/pF. (Middle, bottom) Oscillatory behaviors, as well as zero-current potentials and their stability, of the model system, calculated during increases in gK,b, gKr, or gKs at an interval of 0.01–0.1 pS/pF. Bifurcation diagrams with the steady-state (EP1–3) and periodic (MDP, POP) branches, as well as Hopf bifurcation (HB) and saddle-node bifurcation (SNB) points, were constructed for gK,b, gKr, or gKs (middle). Maximum upstroke velocity (Vmax) and CL of the potential oscillations were also plotted against gK,b, gKr, or gKs (bottom). The vertical lines for IKr and IKs represent the standard values of gKr (12 pS/pF) and gKs (36 pS/pF). The symbol “ID” designates the irregular dynamics.

