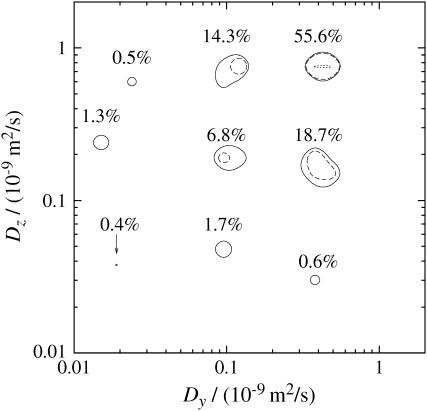
FIGURE 9.
A two-dimensional projection of the DDCOSY map presented in Fig. 8. The probability distribution given by the T2 corrected percentages refer to the integral value under the individual peaks. The error is estimated to be 3%. In contrast, the isolines refer to the highest peak and are labeled 1% (—), 10% (- - -), and 100% (⋯⋯) of the peak height.

