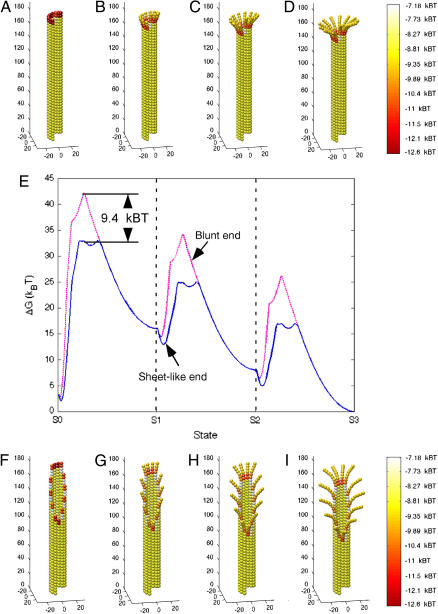
FIGURE 5.
Energy analysis of blunt-end and sheetlike microtubule tips undergoing catastrophe. Simulated microtubules with a tubulin-GTP cap one-layer-deep were adjusted (i.e., peeled outward) to produce a catastrophe-like final state (S3). State 1 (S1) was achieved by curling the second layer from the top radially outwards at 22° (B and G). Subsequent states were achieved by repeating this step one-layer-deeper per state (C, D, H, and I). Energy was calculated at 100 intervals between states to produce the energy plot in E. Diagrams of each state (A–D (blunt end) and F–I (sheetlike end)) are aligned with the energy plot (E). Blunt-end microtubules (dashed magenta line) pass through a higher energy intermediate (∼9.4 kBT higher) than sheetlike microtubules (solid blue line) as the catastrophe progresses from state 0 (S0) to state 1 (S1) (E). This analysis indicates that sheetlike microtubules are e9.4 (∼22,000) times more likely to undergo a catastrophe by this particular pathway (see text for details).

