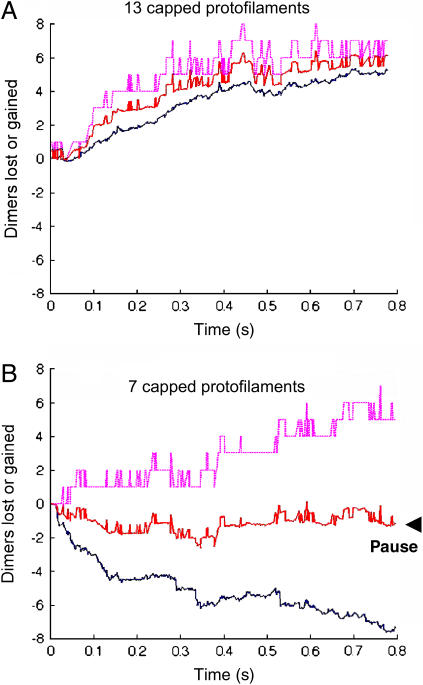
FIGURE 7.
The number of dimers lost or gained for 13 capped protofilaments (A) and for seven capped protofilaments (B) was simulated. Simulations began with tubulin-GTP four layers deep in each experiment, with 13 × 4 = 52 total tubulin-GTPs in A and 7 × 4 = 28 total tubulin-GTP in B. Solid blue lines indicate total dimers gained or lost per protofilament. Dashed magenta lines indicate dimers lost or gained when measuring the leading edge, or longest protofilament. It is reasonable to suppose that the microtubule length recorded by VE-DIC microscopy would be approximately the average of the leading edge and the average polymer loss or gain (red lines). The experimentally recorded growth rate in A would thus be ∼2 μm min−1, but in B there would appear to be a pause, without growth or shortening.

