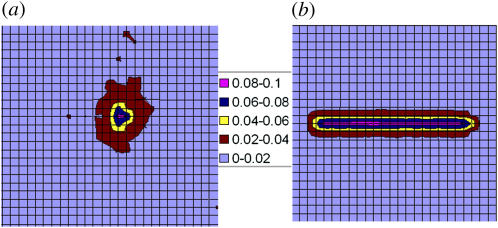
FIGURE 11.
Contour maps of PIP2 density in the membrane plane. The area per square of the grid corresponds to one lipid molecule. (The square grid is used here just for display; the simulations were carried out using a two-dimensional hexagonal lattice.) The figure on the left, a, is for a flexible 20-segment chain interacting with a fluid membrane of average composition PC:PS:PIP2 = 98:1:1. The figure on the right, b, is for a rodlike polymer of the same length and charge. The rod is placed at distance z = 1 from the membrane. The polymer's first segment is fixed at z1 = 1. The numbers labeling the color code indicate the local mole fractions of PIP2. The average membrane concentration is 0.01.

