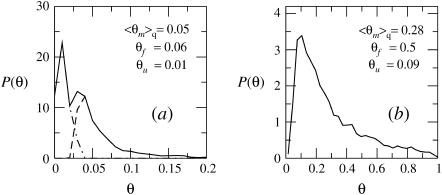
FIGURE 8.
The distribution of surface concentrations, θ, for an ensemble of quenched membranes of composition PC:PS:PIP2 = 98:1:1 (a) and PC:PS:PIP2 = 89:10:1 (b). Also listed are the average surface coverages of the fluid, quenched, and uniformly charged membrane. In a, the solid curve is the overall distribution of θ values, whereas the dashed and dash-dotted curves correspond to the distributions of θ-values for membranes with ΔFm < 0 and ΔFm > 0, respectively. In all cases the volume fraction of macromolecules in the bulk solution is 

