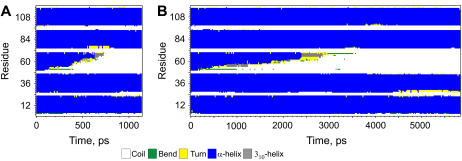
FIGURE 8.
Peptide secondary structure evolution for two simulations with the same loading rate: (A) with a 0.166 N/m cantilever at 0.125 Å/ps pulling velocity, and (B) with a 1.667 N/m cantilever at 0.0125 Å/ps pulling velocity. The time required to unfold and extract the peptide is different, as is the peptide unfolding path.

