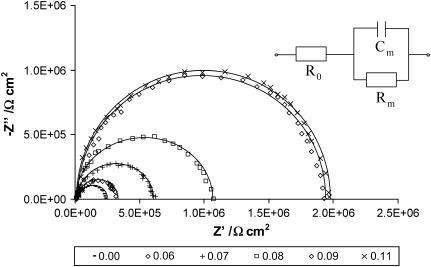
FIGURE 1.
Dependence of an imaginary part (−Z″) on the real part (Z′) over a frequency range of 0.1 Hz to 10 kHz for a phosphatidylcholine membrane modified with ergosterol. A different content of ergosterol (expressed as a molar fraction) is illustrated by the different point's shapes of the impedance spectra. The solid lines represent the results of the fitting procedure. The equivalent circuit used for impedance data analysis is shown in the inset: R0 represents the resistance of the electrolyte, Rm the resistance of the membrane, and Cm the capacitance of the membrane.

