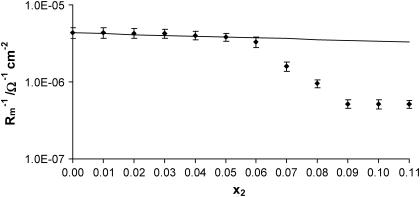
FIGURE 3.
Dependence of conductance  of the phosphatidylcholine/ergosterol membrane on the molar fraction of ergosterol x2. Experimental points represent the mean ± SE obtained from six membranes. The solid line represents the theoretical values calculated according to Eq. 13b.

