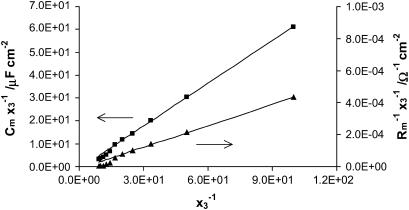
FIGURE 6.
A plot illustrating Eqs. 14a and 14b, from which the surface area of phosphatidylcholine/ergosterol domain can be determined. The value Cm represents capacitance of the membrane,  conductance of the membrane, and x3 molar fraction of the domain. Solid lines represent the theoretical lines calculated according to Eqs. 14a and 14b.

