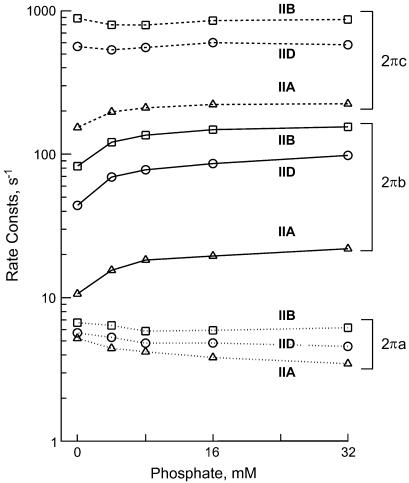
FIGURE 5.
The effect of phosphate on the apparent rate constants in three fiber types. Type IIA fibers from EDL, average of five experiments; type IID fibers, average of seven experiments; and type IIB fibers, average of 15 experiments. The means are shown; ± SE is about the same or smaller than the symbol size in log plots, hence not shown.

