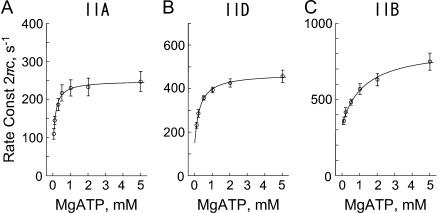
FIGURE 8.
The effect of MgATP on the apparent rate constant 2πc in three fiber types. (A) Type IIA fibers from EDL, average of four experiments. (B) Type IID fibers, average of six experiments. (C) Type IIB fibers, average of nine experiments. The mean and ± SE are shown. Continuous lines represent Eq. 4 with best-fit parameters. Note the change in the ordinate scaling in three panels.

