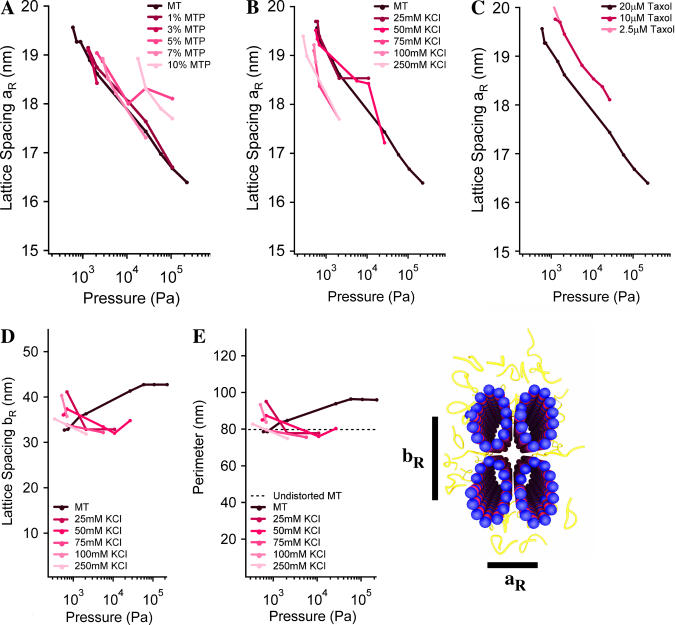
FIGURE 10.
Continued deformation of rectangular bundles with increasing osmotic pressure, aR and bR, measured by small angle x-ray scattering are defined as in the cartoon. The slope of aR versus the logarithm of pressure is the same for (A) all amounts of MTP, (B) all concentrations of KCl, and (C) all concentrations of taxol. (D) bR and (E) the calculated MT perimeter versus osmotic pressure (see text).

