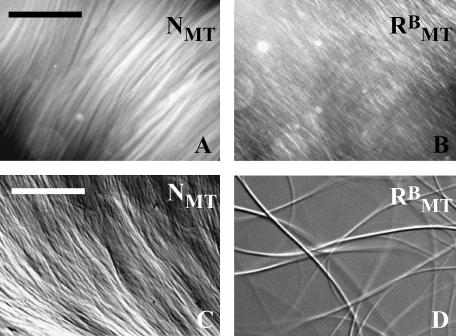
FIGURE 2.
Optical micrographs of MTs and MT bundles with 20 k PEO. Polarized microscopy of (A) MTs with no added PEO and (B) MTs with 0.42% (wt/wt) 20 k PEO (scale bar = 500 μm). Video-enhanced DIC microscopy of (C) MTs with 0.2% 20 k PEO and of (D) MTs with 1% 20 k PEO (scale bar = 10 μm). With low concentration of added 20 k PEO (A and C), MTs are oriented on μm to mm length scales, denoted NMT. MTs form bundles with higher concentrations of added PEO (D) which display weaker large-scale orientation (B). X-ray scattering experiments demonstrate that these bundles are in the rectangular phase, 

