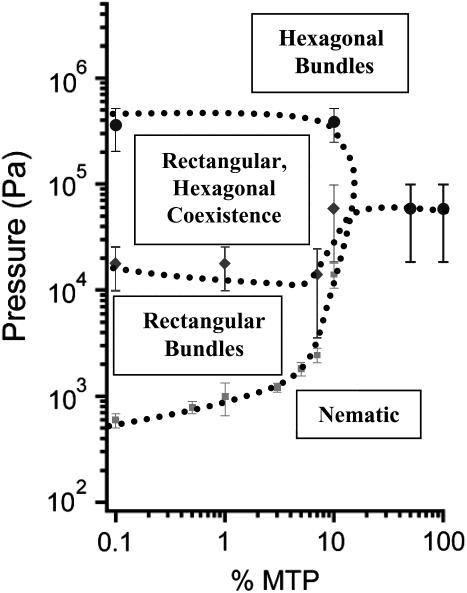
FIGURE 7.
Osmotic pressure-MTP phase diagram measured with 20 k PEO. Tubulin (phosphocellulose chromatography purified) phase boundaries are indicated as 0.1% MTP. Dotted lines are guides to the eye. Regions where rectangular bundles are observed are shaded with a grid. Increasing the percentage of MTP results in a drastic increase in the pressure required to observe rectangular bundles. No rectangular bundles are observed for >10% MTP.

